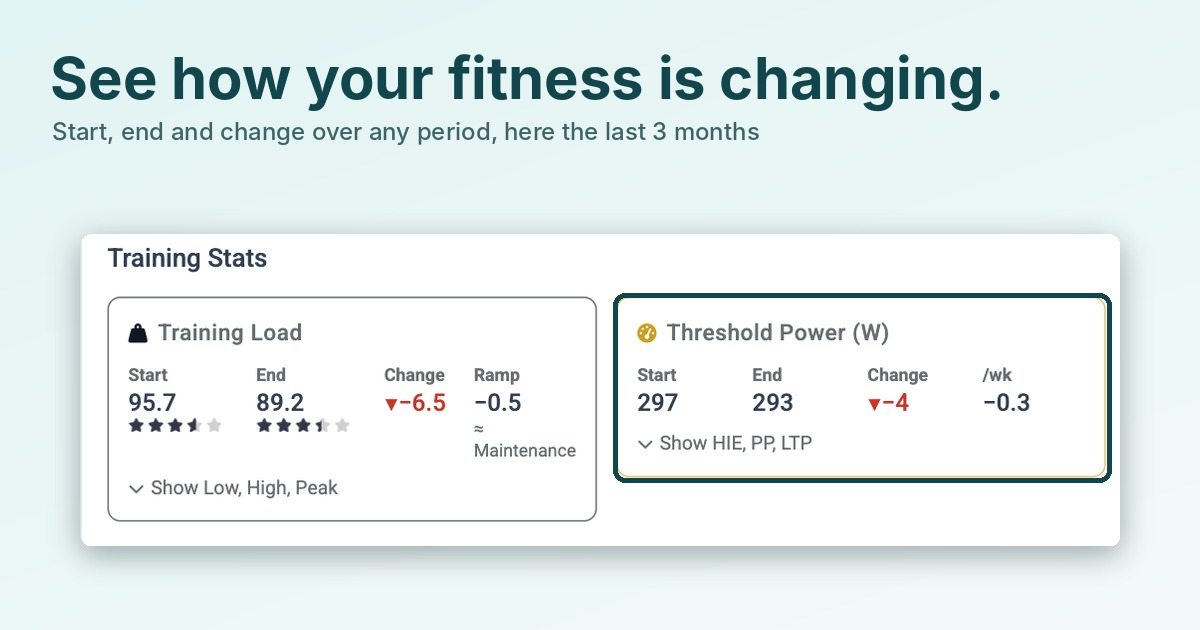
How much did you really train this spring? Did your Threshold Power move over the winter? Was last month’s ramp too steep? Questions like these have a way of getting answered by memory, and memory rounds in our favour.
The Progression tab on My Fitness gives you real answers in place of guesses. You can see whether your fitness moved over the period, how the rides you chose compare with the rest of your training, and whether you’re building at a pace you can sustain, all in seconds. Look at any period you like, narrow it to just the rides you want to judge, and you know what’s working and what isn’t, so your next block of training starts from facts.
Already on Xert? Open My Fitness and choose the Progression tab.
Judge Exactly the Training You Want to Judge
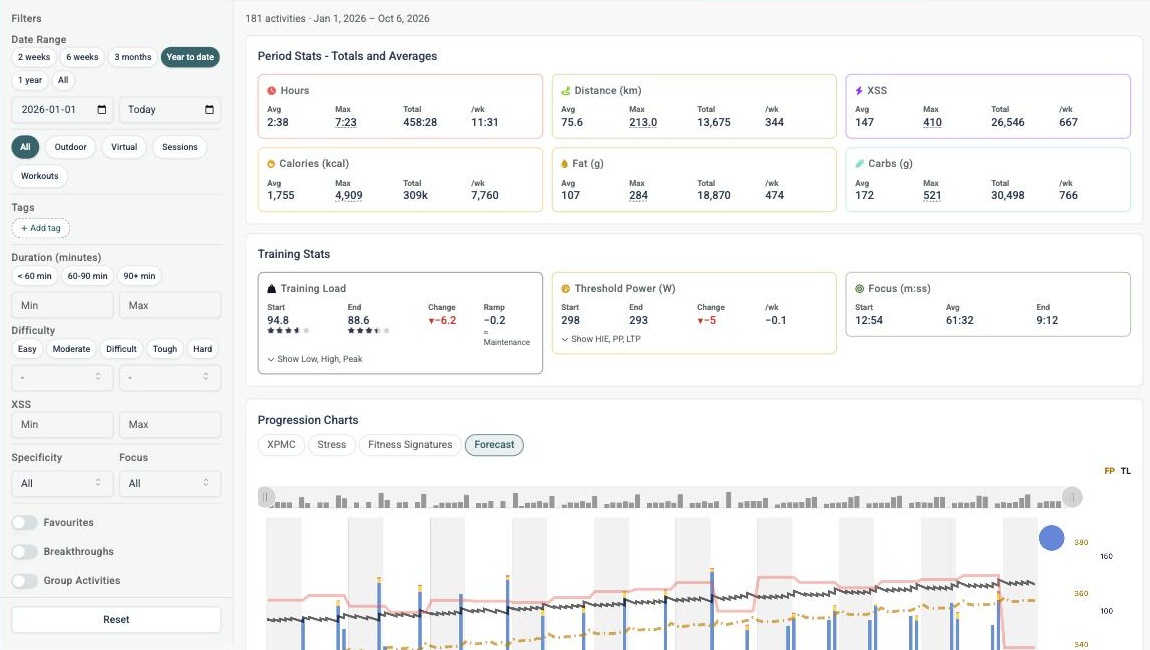
Not every ride tells you the same thing, so you choose what counts. Look at the last 2 weeks, 6 weeks, 3 months, the year so far, a full year or your whole history, or set your own dates. Then narrow it down to the rides you want to judge: outdoor or virtual, sessions or workouts, long rides or short ones, hard days or easy days, favourites, breakthroughs or group rides.
Want to know what your indoor training added up to in the last three months? Pick 3 months and Virtual, and you have the answer.
Know Whether You’re Getting Fitter
The top of the page tells you what you did. Hours, distance, XSS, calories, fat and carbs come with the average, the biggest ride, the total and the rate per week, so a six-week block and a full year can be compared fairly.
Right beside it is how your fitness changed over the same dates. You can see whether your Training Load went up or down and how fast it’s ramping, so you know if you’re building at a pace you can keep up. Your Threshold Power shows how much it moved over the same dates, and the details add High Intensity Energy, Peak Power and Lower Threshold Power. Focus shows how your focus duration changed, and its average across your rides.
One thing to keep in mind: the filters apply to what you did (hours, distance, XSS, calories, and average focus), but not to your fitness. Training Load, Threshold Power and the rest describe where you were on those dates whatever you filtered, so they never change when you change a filter. A “Filtered” note tells you when filters are on.
See Where the Results Came From
Numbers tell you what changed. The charts show you when it changed, alongside the training you did at the time. Four buttons switch between them, they all follow your date range, and you can drag across any chart to set the range from the chart itself.
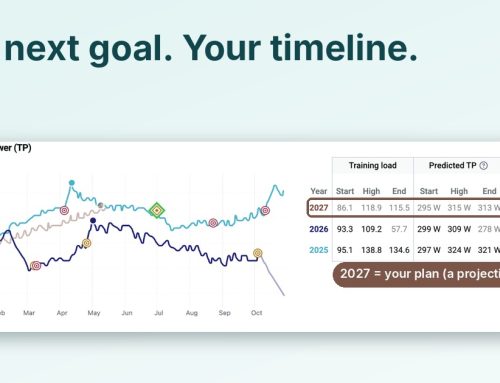
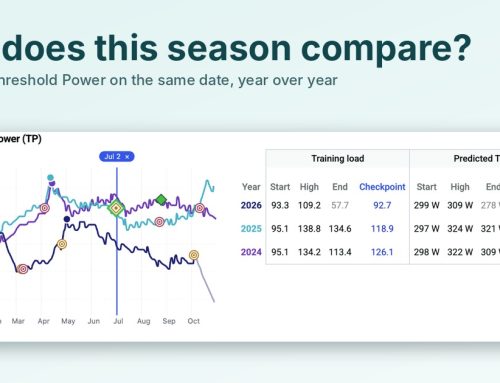
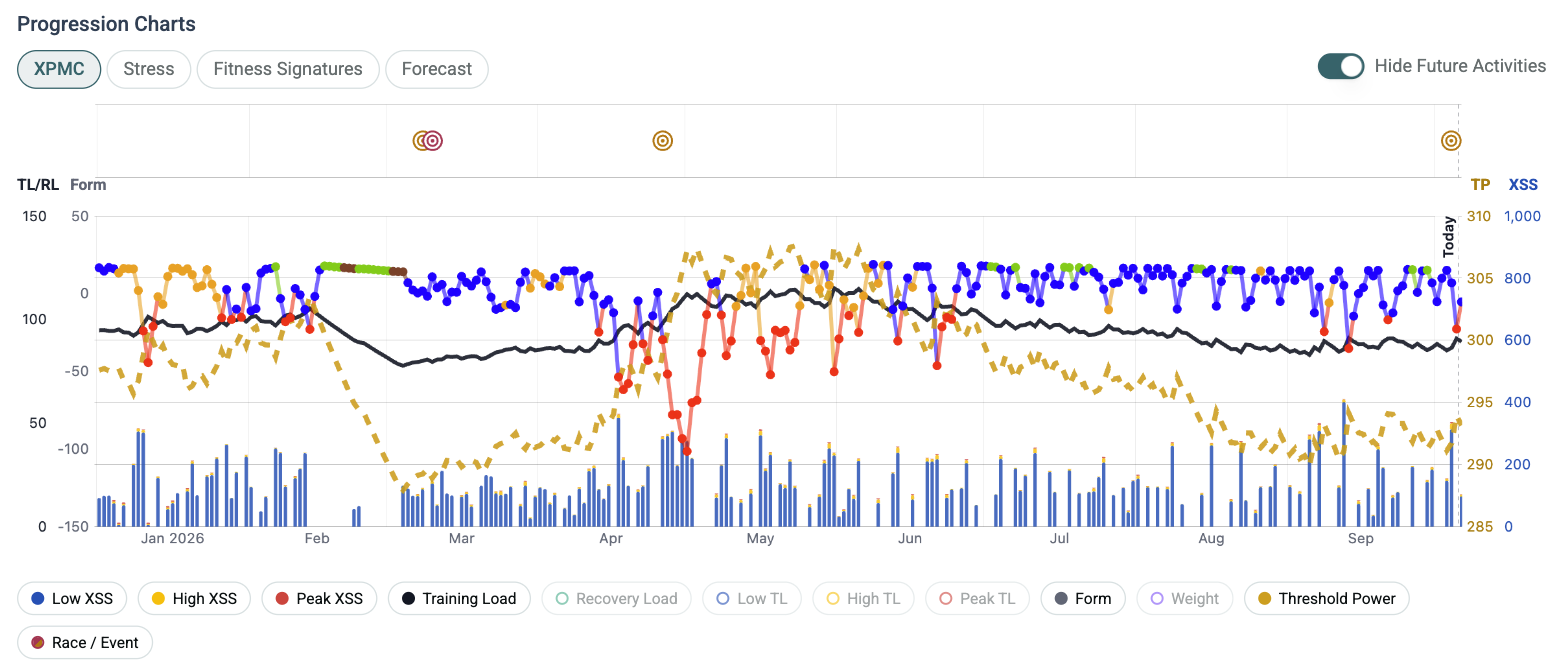
XPMC is the big picture. It shows your Training Load, Recovery Load and Form together with your Threshold Power and each day’s XSS, so you can see how hard training pushed your fitness and when you were fresh or tired. When you filter, the days that match keep their colours and the rest turn grey, so you can see where those rides sit in the whole picture. Races and events you’ve tagged show up as target icons above the chart, and your breakthroughs appear as diamonds. Low, High and Peak Training Load are there too, switched off until you want them.
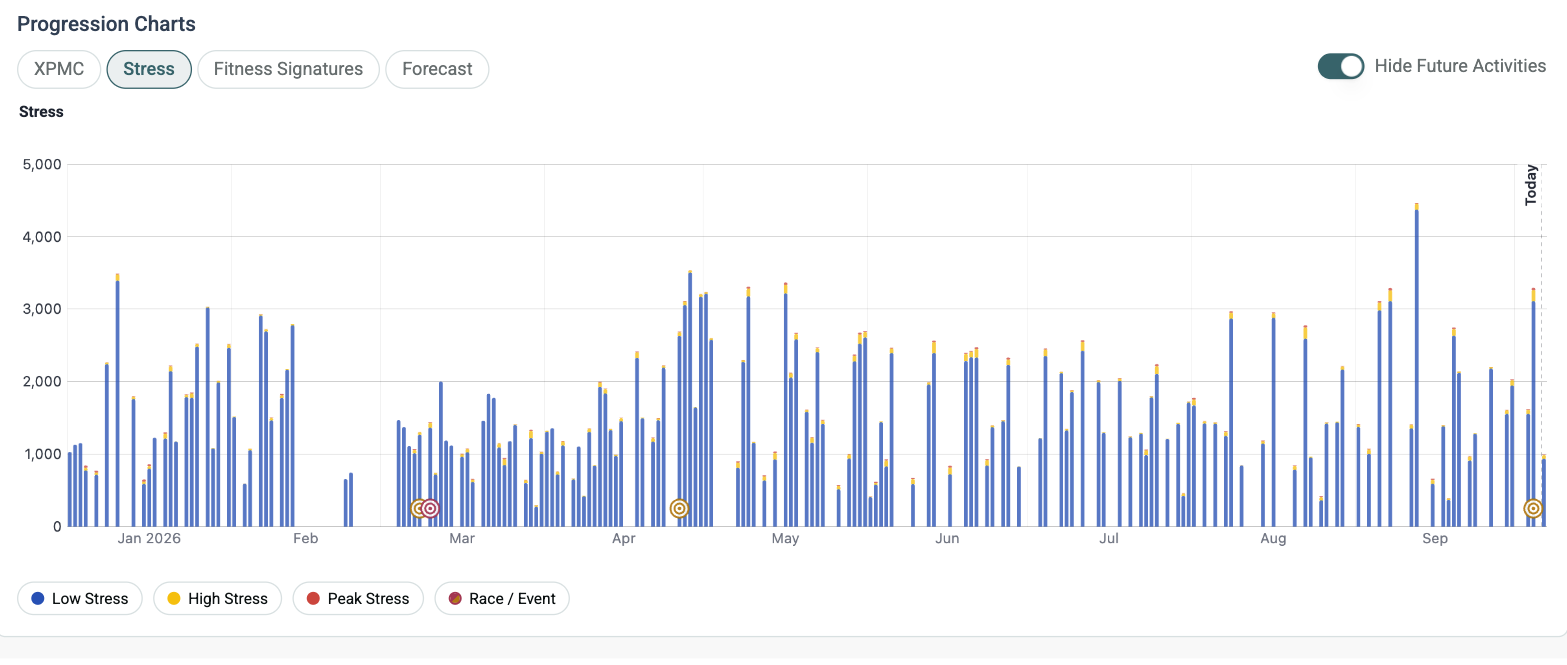
Stress shows which days carried the load, with one bar a day split into low, high and peak. It’s the quickest way to see how often you really went hard, and whether your week was as balanced as you thought.
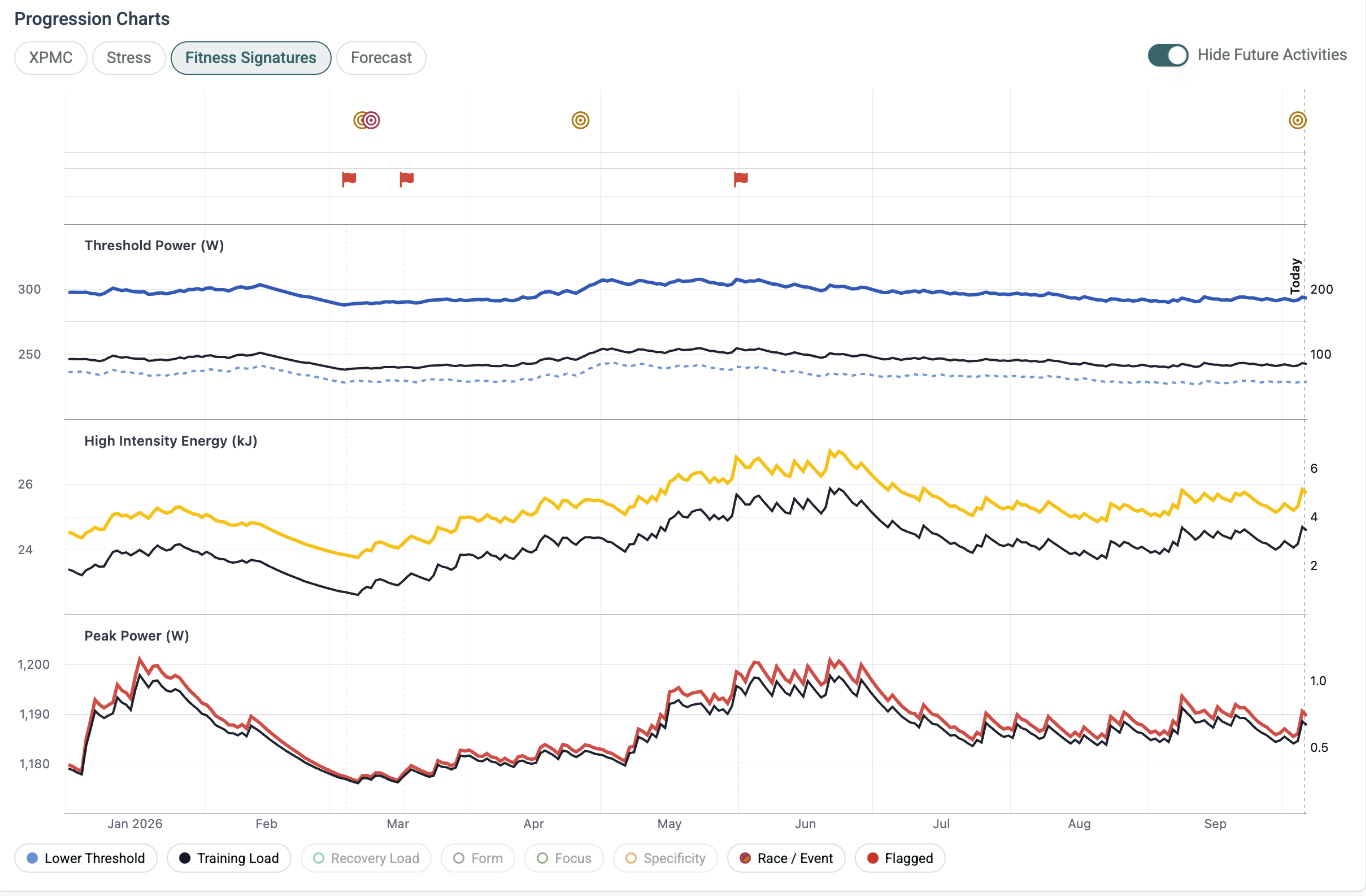
Fitness Signatures shows how your Threshold Power, High Intensity Energy and Peak Power changed, stacked on one time axis so you can see them move together. Breakthroughs, Focus and Specificity can be switched on from the legend.
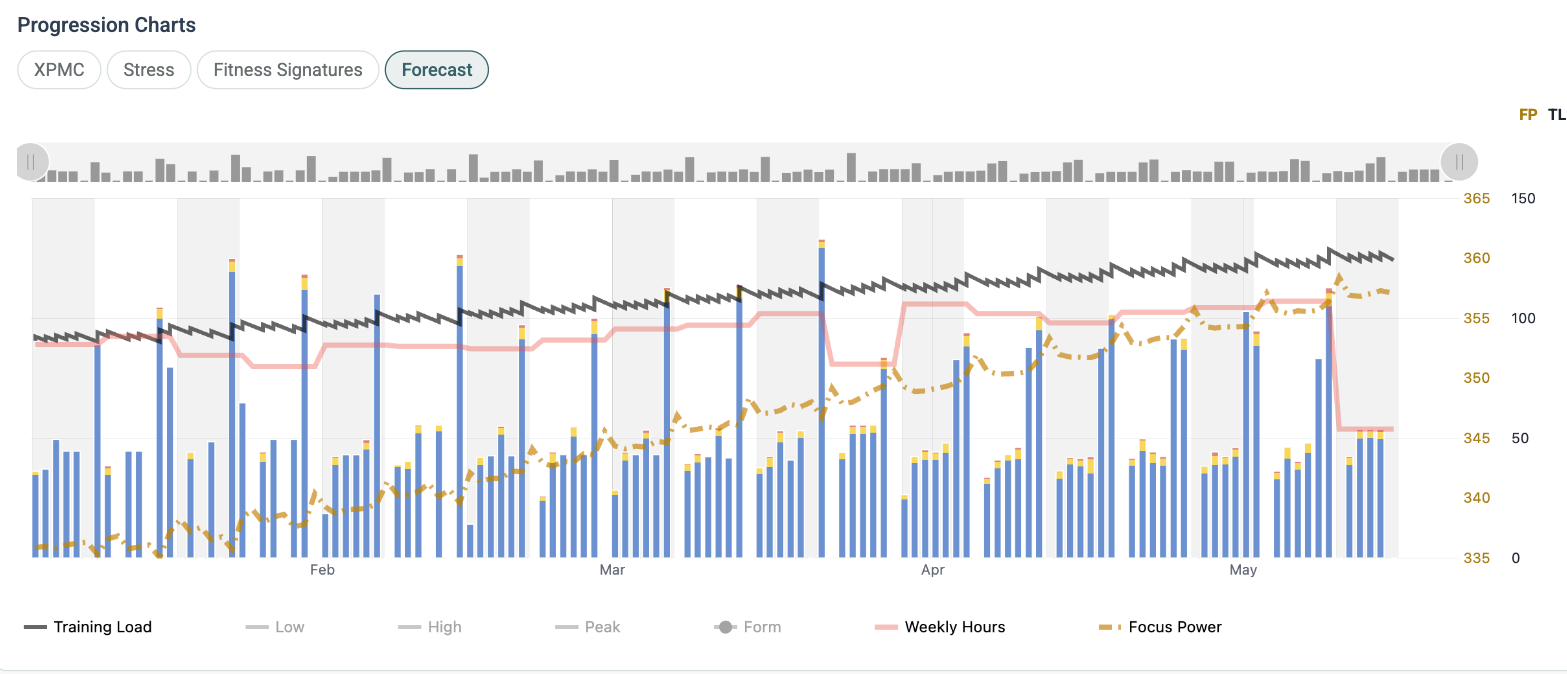
Forecast shows where your plan is taking you. If you have a Forecast AI plan, its planned training load, weekly hours and focus power sit next to your history, so you can check what the plan asks of you. If you’re planning a season ahead, this is where you see it.
Use the Hide Future Activities switch on the XPMC, Stress and Fitness Signatures charts to look at only what you’ve done so far.
Try It Yourself
- Open My Fitness and choose the Progression tab.
- Pick a date range, such as 3 months or year to date.
- Look at your weekly hours and XSS, and at the change in your Training Load and Threshold Power.
- Narrow it down, for example to Virtual rides or to rides over 90 minutes, and see how the totals change.
- Switch between XPMC, Stress and Fitness Signatures to see where the numbers came from.
New to Xert? Start your 30-day free trial at www.xertonline.com.