

Xert has never been a one-number platform. Your performance isn’t governed by one number either. Xert has always tracked Threshold Power (TP), High Intensity Energy (HIE), and Peak Power (PP) — three numbers discovered from the data in your actual rides.
With Xert 2.0, the bar moves higher. Xert now uses an integrated metabolic model to estimate how energy from phosphocreatine, muscle glycogen, blood glucose, and fat contributes to your performance. These estimates are built directly from the power data you’re already recording. No routine lab test or blood draw is required. Just ride.
Laboratory testing can directly measure aspects of physiology that power data alone cannot. Xert 2.0 takes a different approach: it uses your ride data and a unified model to provide practical, individualized estimates that can be examined on every activity.
Introduction to Xert 2.0
Xert 2.0 is the evolution of the current Xert system. It deserves the “2.0” label because it represents a major shift in what the platform can model. The current version uses power-data analysis to explain who you are as an athlete and how training affects your ability to perform.
Xert 2.0 extends this analysis by estimating how several physiological energy systems contribute to the power you produce. Here’s what’s been added:
- Analyzes very short efforts using a new model of the phosphocreatine system, also known as PCr.
- Analyzes very long rides using a new model of muscle glycogen availability and durability.
- Helps you understand how carbohydrate intake and modeled muscular uptake may affect your performance.
- Estimates how different energy sources contribute at different intensities. It doesn’t just identify your zones; it connects them to modeled thresholds, capacities, and energy use.
- Brings everything together to estimate the power you have available throughout your ride — from a few seconds to many hours.
What Actually Changed — In Depth
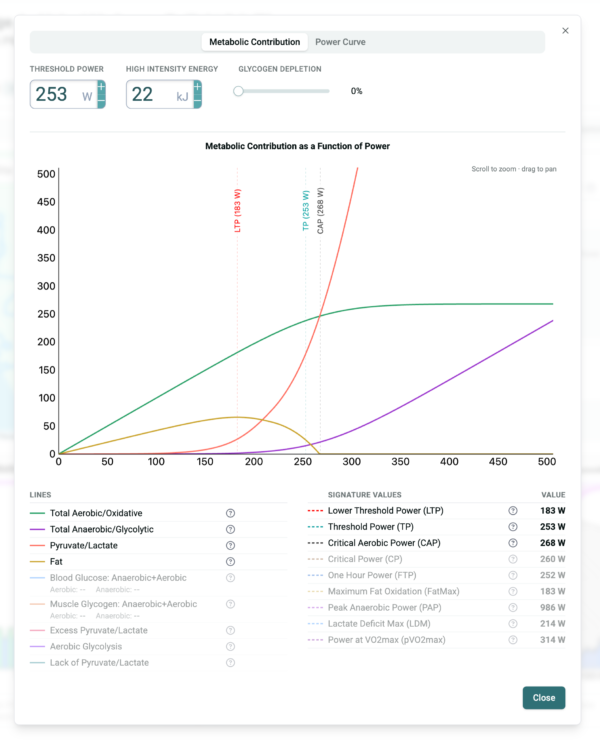
| Before (Xert’s 3-parameter Fitness Signature) | After (Xert 2.0) |
|---|---|
| Your existing Fitness Signature is made up of Threshold Power (TP), High Intensity Energy (HIE) and Peak Power (PP) | Your new Fitness Signature has added new elements needed to create a more complete view of you as an athlete. |
| HIE as one anaerobic reserve | Split into a seconds-scale PCr buffer and a longer HIE reserve, modeled independently |
| Substrate utilization (fat and carbs) estimated using generalized models. | Substrate utilization estimated using HIE utilization and the integrated metabolic model |
| Durability estimated as an add-on concept to existing rides. | Durability is modeled directly using your Fitness Signature on every ride |
| MPA unaffected by durability | Fitness Signature variables reflect modeled durability, which affects MPA as the ride progresses |
| MPA unaffected by efforts below TP | MPA is affected by all work rates to some degree |
| LTP calculated from the signature to guide training | LTP now becomes a core fitness parameter on which other signature parameters are derived |
| Long duration values on your Power-Duration curve were “in theory” estimates | Long duration estimates are derived from your Fitness Signature, including your durability parameters, which can be adjusted to match each athlete’s physiology |
Why FTP Alone Doesn’t Tell the Whole Story
FTP and how to measure it have been the subject of debate after debate. Is it the power you can hold for an hour? Is it supposed to match your Maximal Lactate Steady State? Is 95% of your 20 minute power always your FTP? Should it be higher or lower for different types of workouts?
For those of you that are familiar with CP/W’, how do FTP and CP relate? Are they the same? Should they be? CP can be highly dependent on the method used to estimate it. It’s been said that CP can be held for a very long time. How long is that? No one is quite sure.
So much confusion and thus so many debates.
Xert 2.0 provides a new way to explore how these concepts relate to one another within a single model. It doesn’t just calculate FTP; it shows how threshold power relates to the other parameters that shape performance. For example, an athlete can increase FTP while reducing modeled performance on very long rides. Xert 2.0 shows how changes in durability and energy availability can produce that result.
How the Xert 2.0 Model Aligns with Physiology
Everything above comes down to this picture: your body has several different sources of energy, and each one behaves differently. 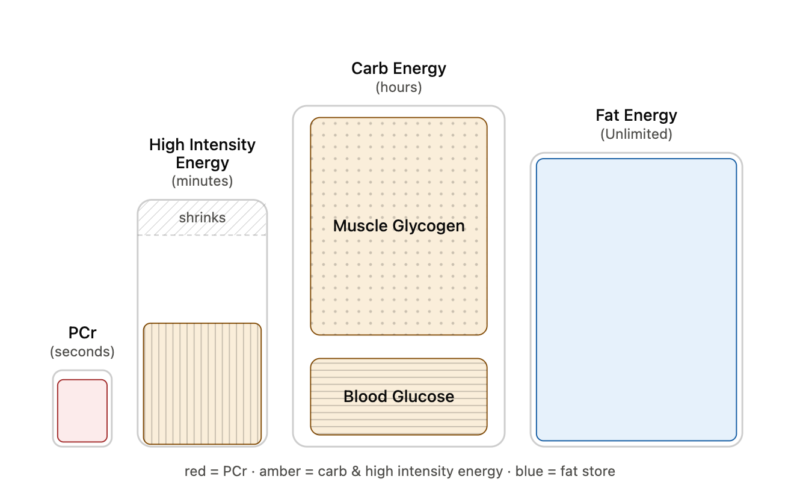 Xert 2.0’s real change is that it now estimates the state of these systems second by second throughout your entire ride — instead of collapsing them into one or two numbers. Here’s what that looks like in practice:
PCr: Your Nitro Boost
Short, hard efforts tap a separate buffer — phosphocreatine — that empties and refills in seconds. It’s why you can go hard, ease off for 20 seconds, and go hard again almost as hard. A model that treats anaerobic capacity as one battery has difficulty explaining that behaviour. Xert 2.0 uses a separate PCr component to account for it.
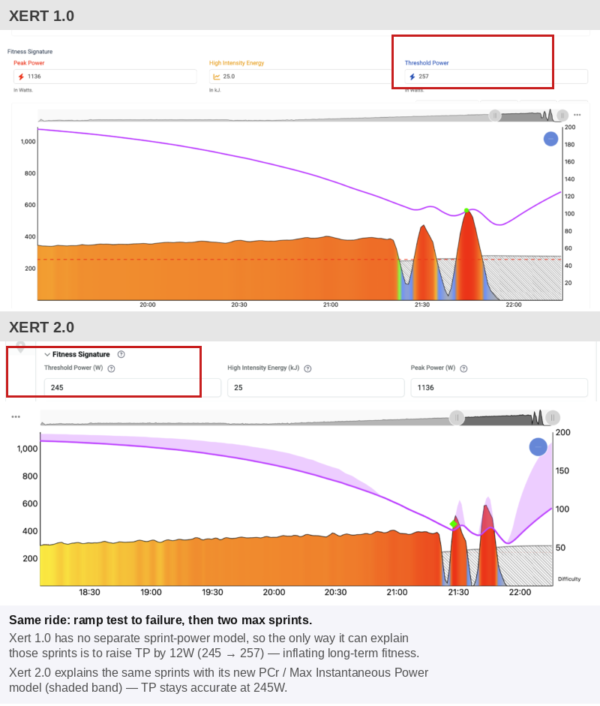
In the example below, a rider did a ramp test to failure, then sprinted twice, all-out. Xert 1.0 has no way to explain those sprints except by raising the rider’s TP — in this case by 12W (245W → 257W), overstating their sustainable, long-term power. Xert 2.0 accounts for the same sprints using its new PCr and Max Instantaneous Power model instead. In this analysis, TP remains at 245W.
MPA With and Without Modeled Durability
Once PCr is spent, you’re pulling from muscle glycogen (local, finite, slow to refill) and blood glucose (continuous, topped up by food and by your own liver). How much carbohydrate you eat isn’t the same as how much your muscles can use. Xert 2.0 estimates that uptake and uses it to model both the energy available for hard efforts and the replenishment of glycogen when you ease off.
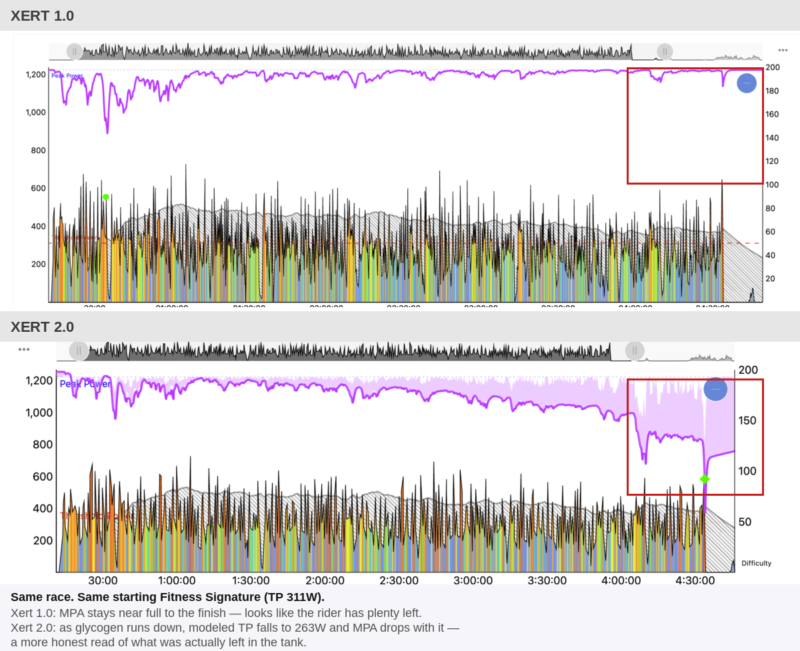
Below is an illustrative model analysis using power data from the 2025 UCI World Gravel Championships. In Xert 1.0, MPA stays elevated right to the finish — it looks like the rider still has plenty left. In Xert 2.0, the story is very different: as modeled glycogen availability declined, estimated TP dropped from 311W to 263W over the race, and by the finish the model indicated little power remained for a sprint. That gap between “what the model says” and “what the rider’s legs actually had” is exactly what Xert 2.0 is built to close.
MPA Below TP — Before and After
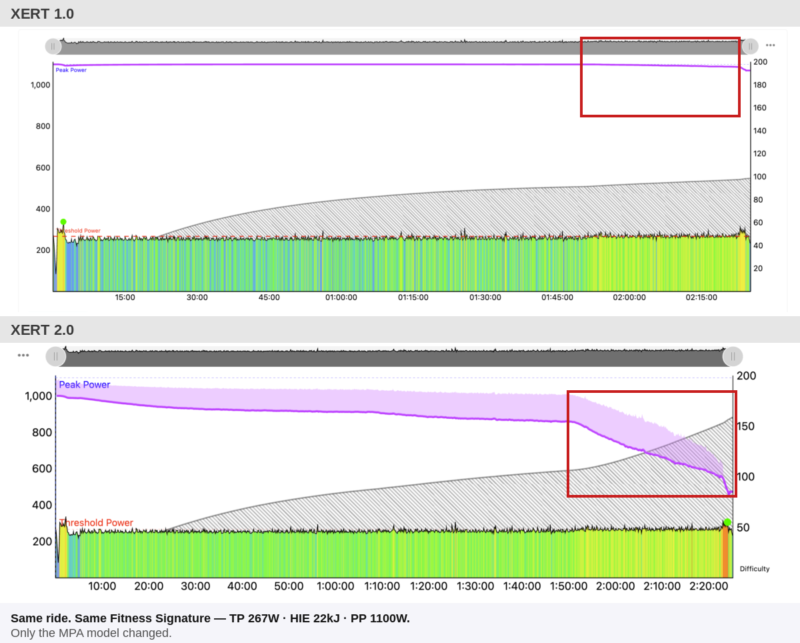
Durability isn’t limited to hard efforts. In Xert 1.0, MPA holds steady during a steady-state ride at or just below TP — implying you’ve still got a sprint in you no matter how long you’ve been riding at FTP.
Xert 2.0 models depletion at every intensity, so the same steady effort can show you gradually approaching a breakthrough, even while riding at or slightly below FTP — a more better representation of your fatigue. read of where you actually stand.
Here’s the same power file with the same Fitness Signature. In Xert 1.0, the athlete’s MPA barely moves, suggesting the athlete could still generate a maximum power sprint at the effort’s conclusion. However, in Xert 2.0, the MPA gradually declines and nearly reaches a breakthrough by the end of the same steady effort, despite most of the ride being near (or below) the athlete’s starting FTP.
Lower vs. Higher Modeled Durability
Durability isn’t just about the ride — it’s about fueling too. The same rider, the same effort, can finish with very different durability depending on how much carbohydrate is estimated to reach the working muscles. Change the modeled fueling and glycogen state of the athlete, and Xert 2.0 shows how ride durability and MPA may change with it.
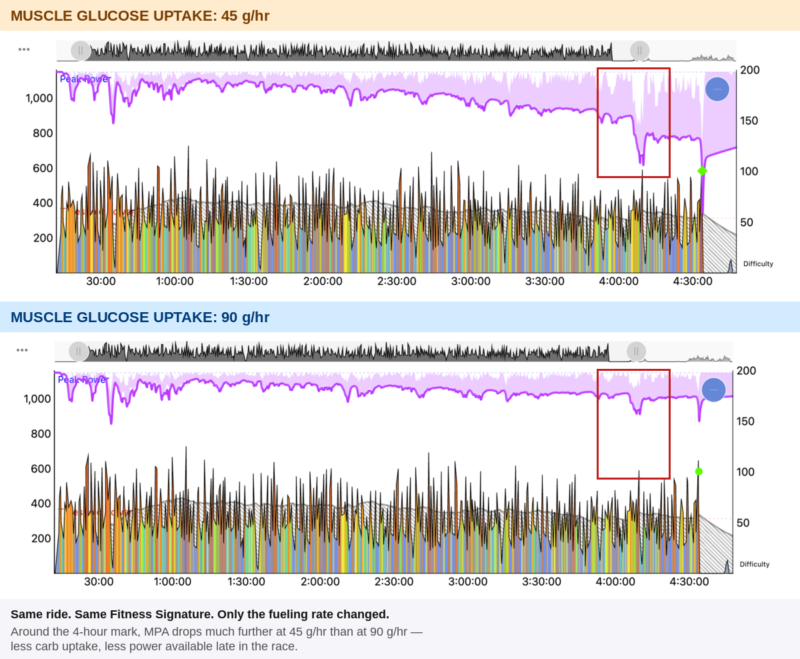
Above is a simulated comparison using the same 2025 UCI Gravel race. On a rough descent, the rider lost a bottle with 200g of carbohydrate in it, dropping their carb uptake to roughly 45 g/hr for the rest of the race. When the same ride is rerun with modeled fueling held at 90 g/hr, the model estimates meaningfully more power available in the final hour. The recorded power is unchanged; only the fueling assumption in the simulation is different.
Common Questions
Do I need new data for this to work?
No. The model uses the ride data you’ve already uploaded. Some parameters and assumptions can be adjusted to better represent the individual athlete.
What’s actually in this beta?
Just the Activity Page — analyzing rides you’ve already done through the 2.0 model. Workouts, training plans, head unit data fields, and mobile apps are later phases, not part of this release.
If I click “Save” on the new page, will this change my current Fitness Signature I use in Xert?
No. The Xert 2.0 Beta Activity Page runs alongside your existing signature and is kept separate. Save only saves your Xert 2.0 signature which is then used when you reopen the page.
Do I need to understand every new model parameter to use it?
No. The Activity Page shows you the results without requiring you to understand every parameter. Terms such as Carbohydrate Absorption Parameter (CAP) and Blood Glucose Production (BGP) are available if you want to go deeper. Use the tooltips throughout the page to learn more.
What’s in the Works
The Activity Page is just the first piece. Xert 2.0 is a new foundation for the whole platform, and here’s what it unlocks next:
- A multi-dimensional XSS: Xert Strain Score’s dimensions will reflect the new model parameters.
- A new Workout Designer: workouts built directly from your 2.0 thresholds and maximal power values, instead of generic zones.
- Updates to the Android and iOS apps and Garmin data fields: bringing these new metrics to your phone and head unit, not just the browser.
- A sharper Adaptive Training Advisor and Forecast AI: recommendations and race predictions driven by the full 2.0 model instead of the 3-parameter signature.
- Broader usability and capability improvements across the app as 2.0 rolls out.
None of this changes what you get today — the Activity Page works now, on the rides you’ve already recorded. This is just where it’s headed.
Where You Come In
Using Xert already?
The Activity Page is the first piece of 2.0 to ship, and it’s landing in phases, not one cutover. After you Join the Xert 2.0 Beta Program, you’ll find it behind a Beta 2.0 button on your existing Activity Details page — it opens right there, embedded, without leaving the site you know.

It’s a closed beta for now. We’re starting with experienced Xert users because they’re the most likely to identify where the model and interface need refinement.
Want the science behind it?
Request the Xert 2.0 White Paper
Work in sports science?
Especially if someone forwarded you this post — a lot of you work in related sports science and may not know Xert well yet. We’d love for you to get involved. If you can compare this model’s output against lactate, indirect calorimetry, or biopsy data, we want to hear from you — as a collaborator, not a customer.
This is a beta because a model this ambitious needs to be tested across many athletes, activities, and independent physiological measurements. We expect the feedback to show us where it needs refinement. The rest of Xert 2.0 will ship the same way, piece by piece.