The Xert Dashboard (XDB) data field gives you real-time insights from Xert during your ride. Integrated with Xert’s Adaptive Training Advisor (XATA) and Forecast AI (XFAI), the XDB field fetches your latest fitness signature, weight, and daily training targets automatically and displays your real-time progress—perfect for unstructured rides, group rides, and endurance days.
If you’re looking for guidance on how to hit today’s exact training targets, check out the Xert Magic Buckets data field instead.
Update: Now Supported on Watches!
XDB is now compatible with over 100 Garmin Edge and Garmin Watch models, bringing real-time Xert metrics to your wrist! Whether you’re training indoors or running outdoors, you’ll get the same adaptive insight wherever you go.
How It Works
Once installed and registered, XDB syncs with your selected training plan – whether that’s via Forecast AI, XATA, or manually selected workouts. When you start recording an activity on your Garmin, the XDB field connects to Xert Online and fetches your:
- Current fitness signature
- Daily XSS targets
- Training status
- Body weight (for performance calculations)
This data is used to update your progress in real time throughout your ride.
Installation & Registration
- Visit the Xert Dashboard page on Garmin Connect IQ Store
- Confirm your Garmin device is compatible.
- Install the data field via the Garmin Connect IQ App (mobile) or Garmin Express (desktop).
- Add the data field to an activity profile on your device.
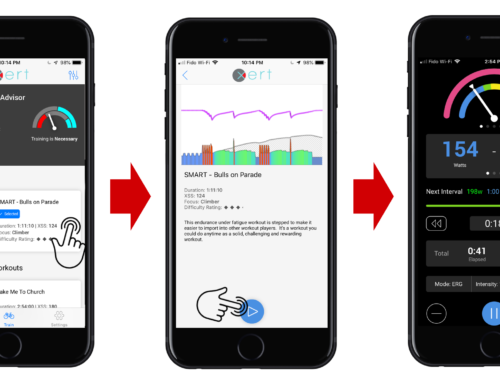
First-Time Registration
To register:
- Start a short recording on a profile with the XDB field installed.
- Save the ride so Garmin syncs the FIT file to Xert.
- Once the file uploads, the field will automatically register for your device. You’ll see a notification in Xert Online saying that ‘Xert Dashboard has been registered for your Edge ___”
⚠️ Important: Xert can only complete registration if the file is synced via Garmin. If your file is synced via Strava, the registration will fail. You can also upload the .fit file manually at XertOnline.com to register the data field.
💡 Note: The installation and registration process is nearly identical to the Xert Magic Buckets data field installation/registration. If you’ve installed Magic Buckets, this follows the same process.
Key Features
1. Pop-up Message & Connection Status
When the ride begins, XDB displays a pop-up confirming it has fetched your latest info. On the left side of the gauge, you’ll see a connection status dot:
- 🟣 PURPLE: your Garmin device isn’t connected to your cell phone (Bluetooth)
- 🔵 BLUE: your cell phone isn’t connected to the Internet (cellular or WiFi)
- ⚫ / 🟠 ORANGE/BLACK: the Field hasn’t yet connected to XERT
- 🔴 RED: the Field failed to log into XERT
- 🟢 GREEN: the Field has successfully logged in and captured your Target
Once connected, the dot will remain green—even if your phone disconnects—until the next login attempt.
Need to refresh your training targets mid-ride? Press STOP > START to re-initiate the connection and fetch updates.
2. “Rainbow” Gauge
The iconic Rainbow Gauge, brought over from Xert EBC, provides a visual overview of your effort and fatigue:
- Outer Ring: Shows remaining HIE (High-Intensity Energy). It depletes as you ride above threshold & replenishes as you ride below threshold.
- Inner Multi-Coloured Gauge: Displays current effort level:
- 🔵 Blue: Below LTP
- 🟢 Green: Between LTP and TP
- 🟡 Yellow: Above TP
- 🟠 Orange: ~3-min power
- 🔴 Red: ~30-sec power
- 🟣 Purple: Near/at MPA
-
The open dot = your 3s average power
Note: The large numeric power display shows 1s power.
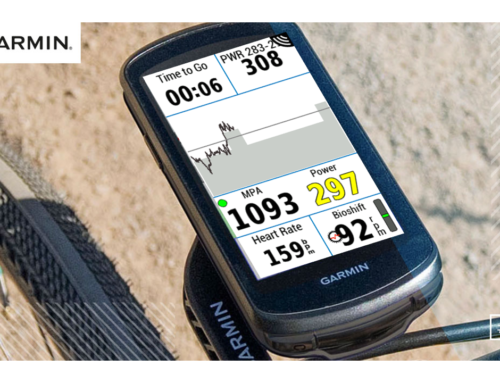
3. Core Data Fields
In full-screen mode, XDB displays:
- Top Left: Speed (kph/mph)
- Top Right: Heart Rate (bpm)
- Bottom Row:
- A customizable power-based metric (e.g. rolling power, %TP, W/kg)
- Smoothed gradient (%)
- Real-time MPA (W)
You can customize the power metric duration (e.g. 3s, 60s, 20min avg) and swap additional metrics using Garmin Express or the Connect IQ app.
4. Additional Metrics (Full-Screen Mode)
On Edge 10×0 devices, you can add 3 rows of 3 metrics (9 total). On Edge 5×0/8×0 units, up to 2 rows of 2 metrics (4 total). Available metrics include:
- Bioshift – shows your real-time cadence & recommends when to shift up/down.
- Difficulty – shows your real-time difficulty score.
- Max Effort Time – defines how much time during your activity, you were close to your MPA. Read more in our glossary post, here.
- XSS – Shows the total accumulated XSS from your activity.
- XSS Rate – the average XSS per hour of your activity
- XEP (Xert Equivalent Power) – represents the average power that more closely resembles what the athlete experienced during the activity. The more time the athlete spends working near MPA, the higher the XEP value will be relative to the average power. Note: XEP is affected by your selected activity time method (elapsed, moving, pedaling).
- Pedal % – proportion of your activity time spent pedaling (power > 1 W). It’s given as the percentage of pedaling time/moving time.
- Carbs (g) – estimated total grams of carbs burned during your activity.
- Carb g/hr – estimated average grams of carbs burned per hour during your activity.
- Carb % – estimated total percentage of calories coming from carbs.
- Fat (g) – estimated total grams of fat burned during your activity.
- Wind – directional arrow showing the relative wind direction & wind speed. Note: wind speed is based on your account settings – kph for metric & mph for imperial.
- Torque – shows the real-time torque from your power meter.
- VAM – “Velocità Ascensionale Media”, or the average climbing speed, expressed in vertical meters/hour (m/hr).
- BT % – shows how close you are to a breakthrough at your current power output. 100% would indicate a breakthrough is imminent.
🪣 Buckets Mode (Optional)
Enable “Buckets (?)” to replace the top row of metrics with your Low, High, and Peak XSS progress—ideal for unstructured rides where you’re aiming to hit a target distribution.
5. Breakthrough Alerts
XDB monitors your effort in real time and will display a notification when you’re within 30 seconds of achieving a Breakthrough. If you’re aiming for a BT, use this as your signal to dig deep – don’t stop until you can’t push anymore!
Summary
The Xert Dashboard (XDB) brings the power of Xert’s real-time, adaptive training metrics to your Garmin device – perfect for cyclists who want feedback on their rides without needing a structured workout. Whether you’re chasing a breakthrough or just logging a group ride, XDB keeps your training aligned with your goals.
Need help or having trouble registering? Reach out to our support team via email or check the Xert Forums.